Sales win rate calculator
Measure opportunity win rate and model the revenue effect of a five-point improvement.
- No sign-up
- Calculated in your browser
- Formula shown
- Updated
Current win rate
30%
- At +5 points
- 35%
- Additional wins
- 4
- Estimated revenue impact
- $34,000
Win rate divides closed-won deals by total opportunities; the scenario adds five percentage points, capped at 100%.
How to use the sales win rate calculator
- 01
Enter closed-won deals and total opportunities.
- 02
Add average deal size or pipeline value for a revenue scenario.
- 03
Compare the current rate with the capped +5-point scenario.
What the sales win rate calculator does
Measures closed-won opportunities as a percentage of a cohort and models incremental wins and revenue from a five-point improvement.
Win rate from your cohort
Enter closed-won deals and total opportunities for the same cohort, and the calculator returns win rate as a percentage. Both inputs must be whole numbers, and won deals can never exceed opportunities, so a typo shows an error instead of a rate above 100%.
A capped +5-point scenario
Next to your current rate, the tool shows the rate after a five-percentage-point improvement, capped at 100%, and the additional wins that lift would produce across the same opportunity count. It gives a coaching or enablement plan a concrete target.
Revenue impact two ways
Add average deal size to price the extra wins directly. If you only have total pipeline value, the calculator applies the five-point lift to pipeline instead. With both filled in, it uses average deal size and warns when the two disagree by more than 10%.
Live results you can paste
Every field updates the results as you type, so you can test cohorts quickly during a pipeline review. Copy result places the win rate, scenario, extra wins, revenue estimate and formula note on your clipboard. The math runs locally and nothing is uploaded.
Formula, inputs and privacy
Win rate = won ÷ opportunities; scenario rate = min(100%, win rate + 5 percentage points).
- What you provide
- Won deals, total opportunities, and optional average deal size or pipeline value.
- What you get
- Current win rate, +5-point scenario rate, additional wins, and estimated revenue impact.
- Where your data goes
- The calculator performs local arithmetic and does not transmit pipeline figures.
Who uses the sales win rate calculator
How do sales managers use a win rate calculator?
Front-line managers compare win rates across reps who worked similar opportunity volumes. Entering each rep's won and total deals for the quarter shows who converts well and who generates pipeline that stalls, which points coaching time at a specific deal stage rather than at activity counts.
How do sales enablement teams use the +5-point scenario?
Enablement leads use it to size a program before asking for budget. If better discovery training could plausibly add five points of win rate, the calculator shows how many extra deals and how much revenue that represents on current pipeline, framing the program cost against a specific, checkable outcome.
How do CROs use win rate to test a forecast?
Revenue leaders apply a recent win rate to open pipeline to check whether a forecast is realistic. If the committed number implies a win rate well above what the last few quarters produced, that gap deserves a conversation with the team before the forecast goes to the board.
How do product marketers use win rate after a launch?
Product marketing teams compare win rates on deals that used new positioning, battle cards or a shared product demo against deals that did not. Run the calculator on each cohort separately. A difference is a signal worth investigating, though cohort size and deal mix need checking before anyone credits the launch.
Frequently Asked Questions
Learn how interactive demos work and how ArcDemo helps your team close deals without a live call.
Want early access to ArcDemo? Join the waitlist
Want early access to ArcDemo? Join the waitlist
More free tools
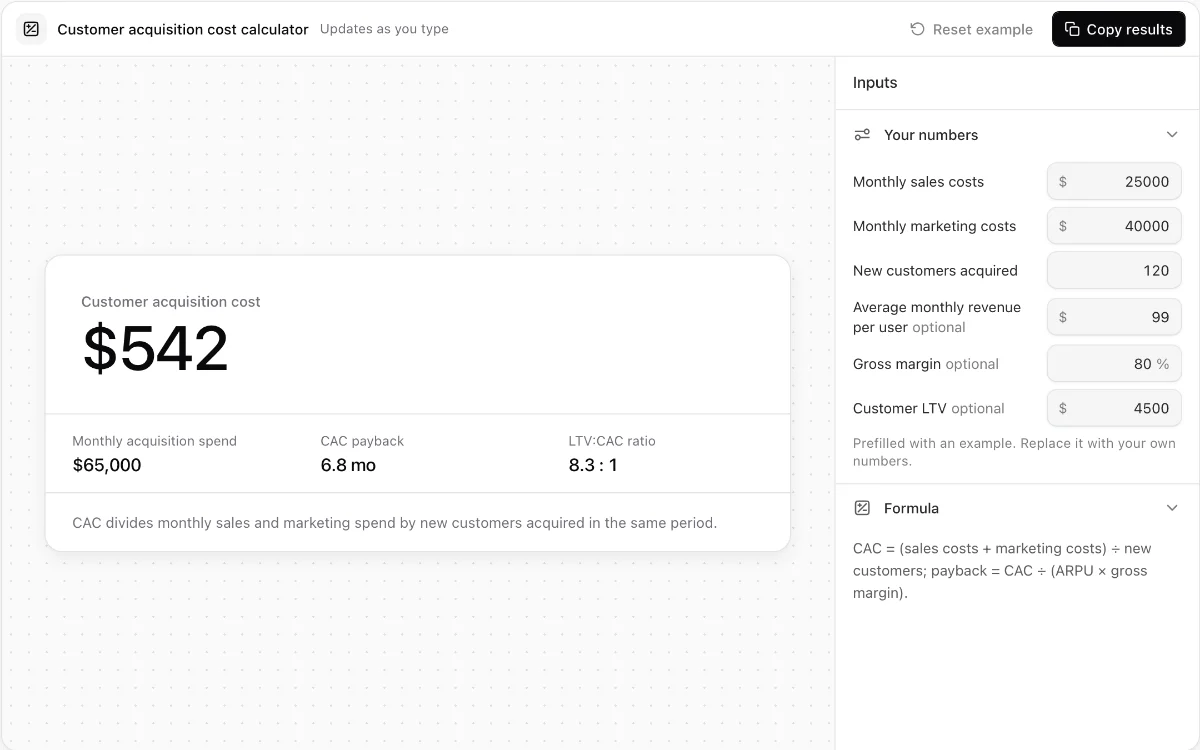
Customer acquisition cost calculator
Calculate blended CAC, optional payback time, and LTV-to-CAC ratio from monthly acquisition inputs.
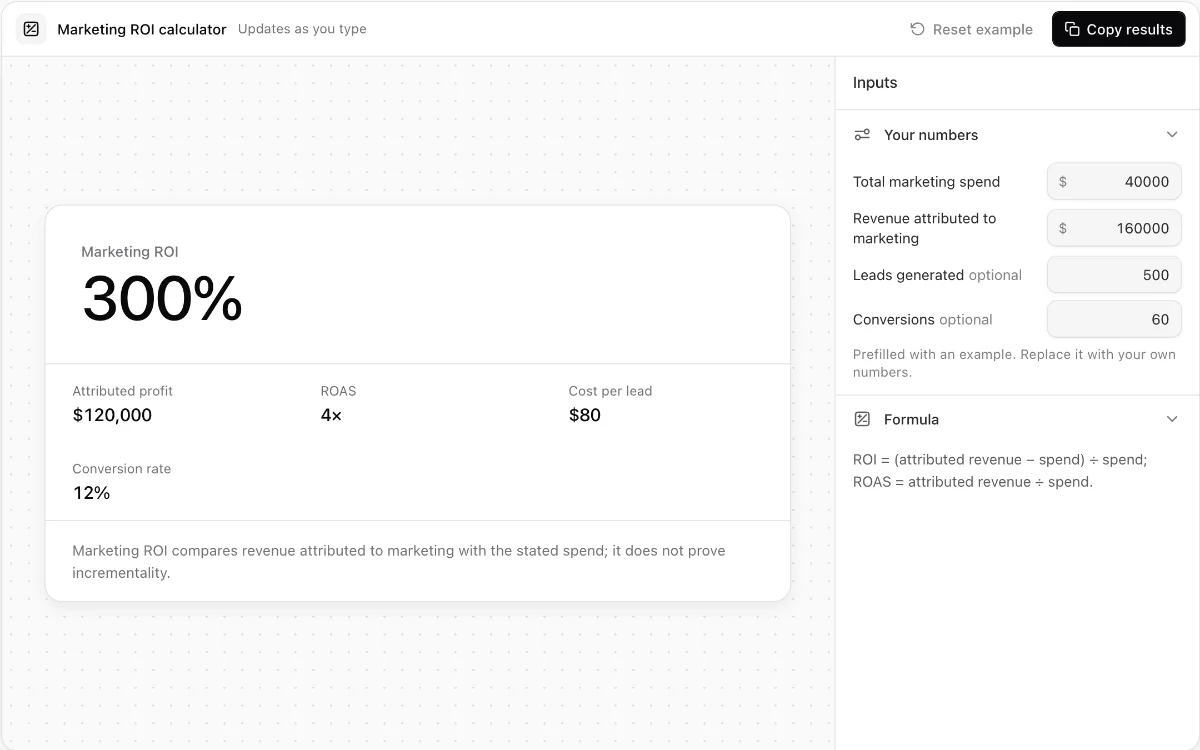
Marketing ROI calculator
Calculate attributed ROI, ROAS, cost per lead, and lead-to-customer conversion rate.
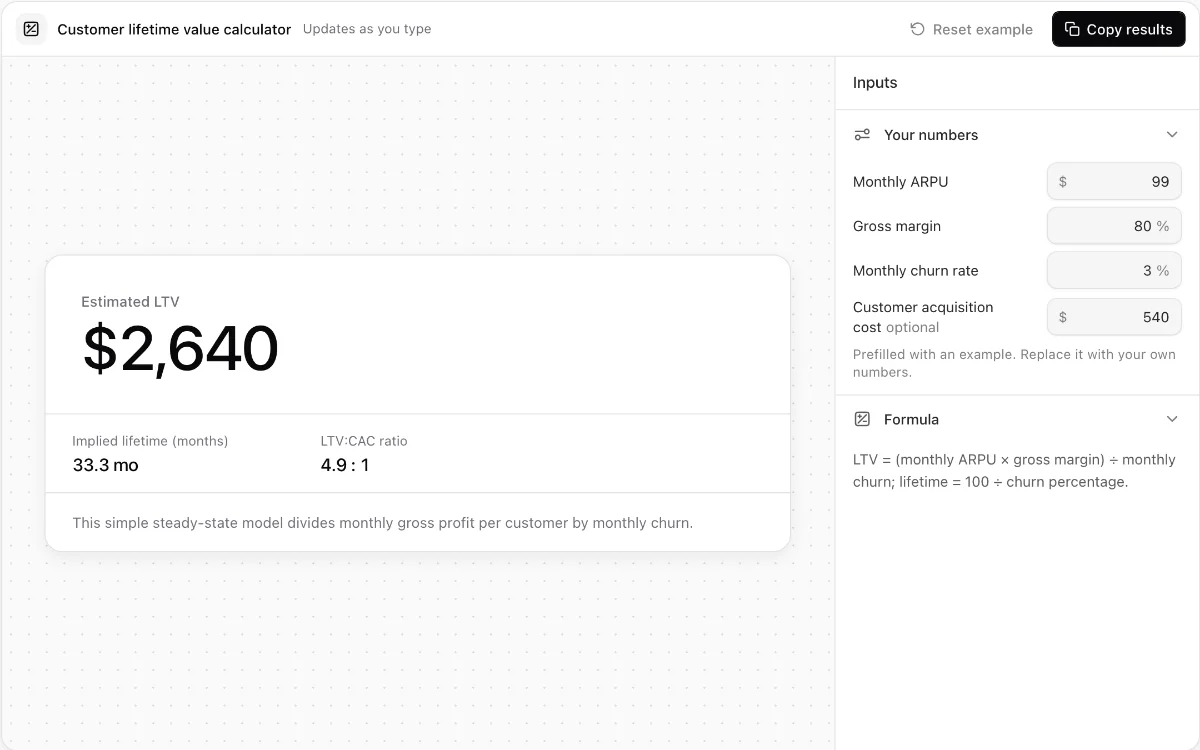
Customer lifetime value calculator
Estimate steady-state SaaS lifetime value from ARPU, gross margin, and monthly churn.
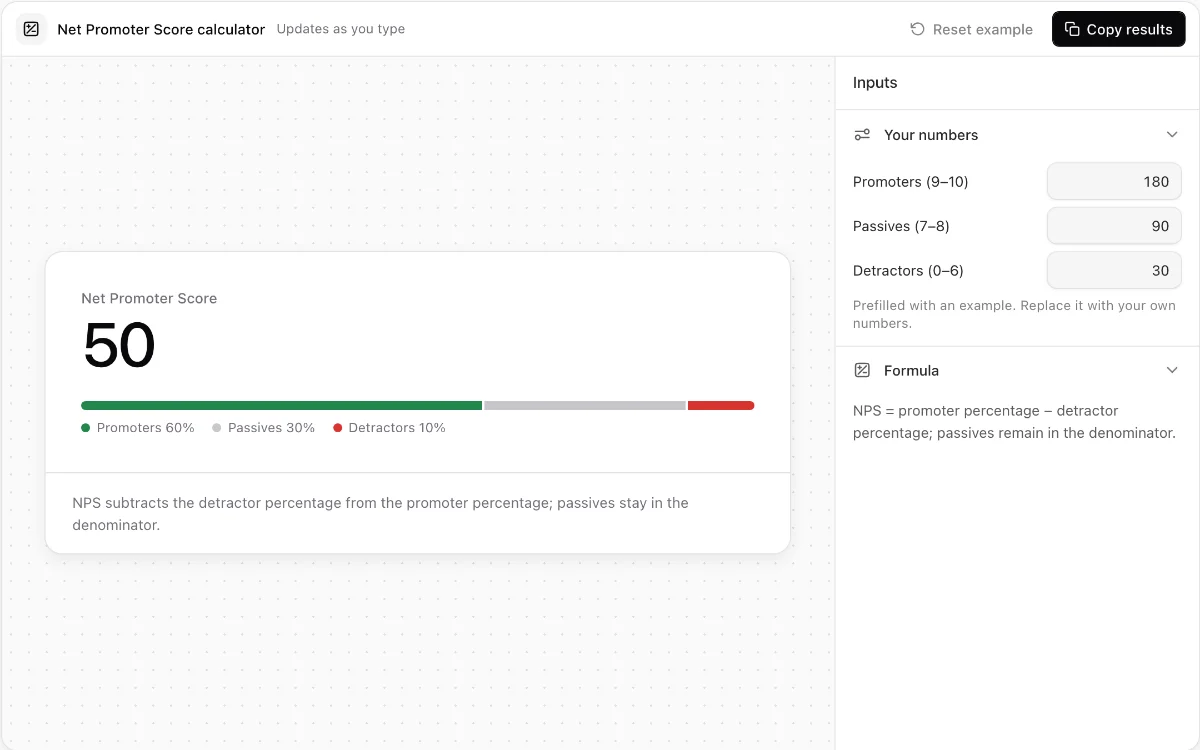
Net Promoter Score calculator
Turn promoter, passive, and detractor response counts into an exact NPS breakdown.
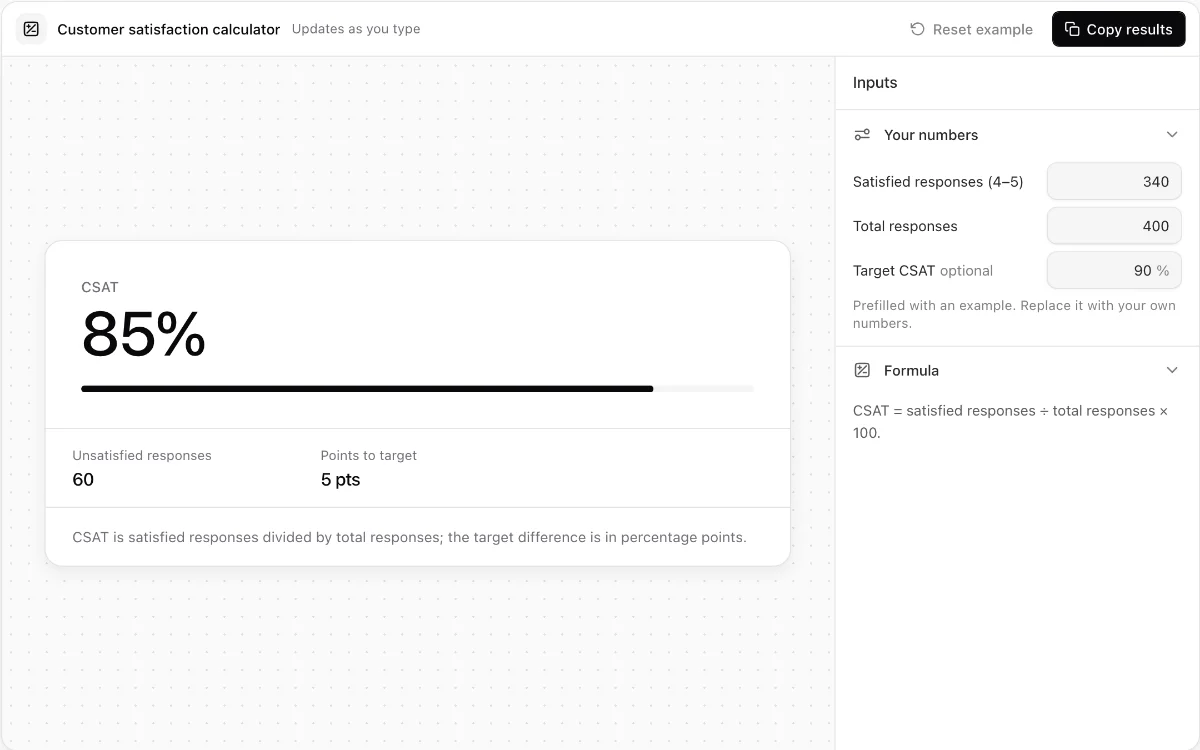
Customer satisfaction calculator
Calculate CSAT, unsatisfied responses, and the percentage-point gap to a valid target.
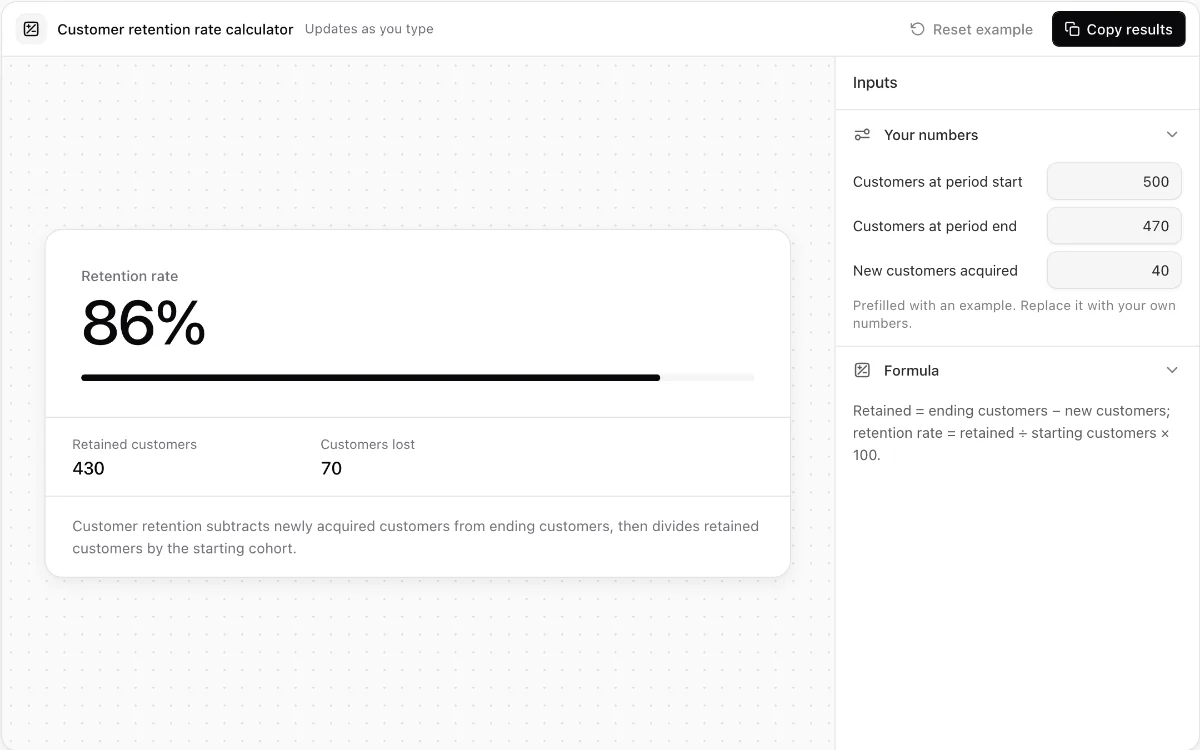
Customer retention rate calculator
Measure retained and lost customers while catching impossible cohort inputs.
Make every demo your next revenue channel
Capture screenshot, HTML, sandbox and video demos of your product and let buyers explore it before they ever book a call.